Cartography is a field of science, technology, and production that encompasses the study, creation, and use of cartographic works. Primarily, cartography studies the relationships between social and natural phenomena and reflects them on geographic maps, plans, and other cartographic works.
Cartographic method is the determination of the location, height, and size of landforms using various maps, as well as the description of various phenomena.
Cartographic works include a wide range of services and activities related to the processing, formation, research, and use of cartographic data. The creation (updating) of maps (plans) is carried out after preparatory work, which may include field topogeodetic surveys, studying existing cartographic products for the specified area, and obtaining remote sensing materials of the area to be mapped, acquired via spacecraft, aerial photography systems, and UAVs. Based on the collected information, a thorough study of the mapping area is conducted, and the technology for creating (updating) cartographic products is developed, along with the drafting and approval of editorial-technical guidelines. Materials from cartographic works find wide application in construction, land management, and other fields. The organization of cartographic works allows for the production of maps and atlases that are used as primary, supplementary, and reference materials, etc.

Problems to be solved
The main task of cartography is the development, creation, study, and use of cartographic works.
In the present time, with the computerization of cartographic science, the tasks of cartography have become:
- the creation of digital and electronic maps, as well as the formation of a digital cartographic information bank;
- providing science, industry, and the needs of the population with high-quality cartographic products;
- expanding the mapping space, including mapping less-studied areas;
- further improving the accuracy of cartographic works and enhancing their content.
As cartography evolves and its research methods improve, the tasks it faces become more complex:
- there is a need to create new types of maps and develop new directions (assessment and environmental state of natural resources, socio-economic studies, forecasting the development of various phenomena, creating cartographic materials for unmanned transport);
- new methods for compiling and using maps are being developed.


All work related to the study of territory cannot do without maps. Even the most detailed description of an area cannot replace a map.
The availability of cartographic data provides the opportunity to:
- solve state tasks in cartography (defense, science, etc.);
- create maps of areas and plans;
- conduct graphical measurement and calculation in forecasting and planning;
- determine important parameters during construction, major repairs, and other works using graphical methods;
- delineate the contours and boundaries of administrative units;
- determine the sizes of cadastral plots and other structures;
- create graphical supplements to various official documents;
- forecast environmental measures in a settlement area;
- control topographic dynamics.
Cartographic services play a significant role in socio-economic activities. They allow for faster work completion, reduced costs, and increased profitability. Accurate knowledge of the territory helps avoid errors in design, construction, and other types of work.
Need for consultation?
Fill the form and we will contact you
Implementation examples
Creation of a digital city model (3D) for large cities with a population of more than 100,000 people
- Tasks:
-
- Creation of a digital twin of the city;
- Spatial analysis of existing networks and the environment;
- Spatial analysis and modeling in the planning of new networks;
- Selection of sites with corresponding calculations for cellular antennas, PCS radio ports, fiber nodes, and repeaters;
- Determination of the optimal cable routing considering main street lines, railways, and various underground utilities;
- Determination of the optimal location of radio relay lines considering surface profiles;
- Determination of optical visibility from antenna locations;
- Modeling of radio wave propagation and analysis of their coverage areas;
- Obtaining geographically referenced measurements of electromagnetic field magnitudes (GIS+GPS) and their analysis.
- Solution:
-
In accordance with the technical specifications, an orthophotomap of the city was obtained, radiometric color correction was performed, colors were balanced and brought to natural tones, and color leveling was carried out on each image individually. The selection, analysis, and acquisition of initial vector data and archival topographic maps in raster and vector formats include the systematization of the source material. Vector data serve as the basis for forming the initial set of vector layers, which are subsequently updated and corrected based on the digital orthophotomap. Based on vector data, the creation of a Digital Elevation Model, a Digital Surface Model, a Clutter Model, and a Height Obstacle Model of the city was carried out.
- Result:
-
- Orthophotomap;
- Digital Elevation Model;
- Digital Surface Model;
- Height Obstacle Model;
- Vector Model;
- Clutter Model.
The digital models are prepared based on the UTM Projection, WGS-84 Ellipsoid, Baltic Height System, and are fully compatible with the Mentum Planet planning tool, as well as compatible with ASSET, ATOLL, and Mapinfo formats.

Creation of topographic maps for the field territory
- Tasks:
-
Creation of digital topographic maps at a scale of 1:25,000 for the territory of deposits in accordance with the requirements of current regulatory documents.
- Solution:
-
- Collection of data on the study of the territory, development of a work methodology;
- Audit of topographic and geodetic data and source materials;
- Assessment of the quality and completeness of existing initial digital topographic maps at a scale of 1:25,000;
- Determination of the procedure and technology for creating digital topographic maps with the preparation and approval of the "Editorial-Technical Guidelines for Updating DTMs" with the Customer.
- Result:
-
DTMs at a scale of 1:25,000 in "ArcGIS" and "MapInfo" formats in electronic and paper form. A technical report on the work performed: in paper and electronic form.

Creation of a topographic plan at a scale of 1:5000
- Tasks:
-
Cadastral accounting of infrastructure objects, monitoring the condition of objects, and the progress of construction using remote sensing methods.
- Solution:
-
Preliminary processing of materials. Initial processing of survey materials was carried out: radiometric, geometric, and atmospheric corrections. Then, to improve the spatial referencing of the images, orthocorrection was performed using control points. Interpretation of terrain objects. The technological scheme for visual interpretation of main pipeline objects from high and ultra-high spatial resolution satellite images involves recognizing natural and technical environment objects and then graphically highlighting them on the image.
- Result:
-
Digital topographic plan at a scale of 1:5,000 in "AutoCAD" format, remote sensing materials, orthophotomap at a scale of 1:5,000, work program for creating a digital topographic plan at a scale of 1:5,000, and a technical report.

Mapping of Sosnovsky's borschevik growing sites in the Smolensk region
- Tasks:
-
Creation of geospatial data sets and digital cartographic works on the locations of Sosnowsky's hogweed in the Smolensk region based on satellite imagery.
- Solution:
-
- Obtaining Sentinel-2A satellite images for the Smolensk region (3 images from 2019 with less than 10% cloud cover);
- Processing the satellite images for each series (Image processing level - L2A, with atmospheric correction and ortho-rectification);
- Mapping the locations of Sosnowsky's hogweed in the Smolensk region;
- Quantitative assessment of the areas infested with Sosnowsky's hogweed in the municipalities of the Smolensk region;
- Creating a set of thematic maps (geodatabase) and a GIS project based on the mapping and quantitative assessment results.
- Result:
-
As a result of the work, the following goals were achieved:
1) A set of satellite images from different times was obtained.
2) A geodatabase of Sosnowsky's hogweed locations in the Smolensk region as of 2019 was created, including data such as:
- A set of vector data in .shp format, WGS84 projection, utf-8 encoding;
- A set of raster data in .tif format, WGS84 projection.
3) A GIS project was created to display the geodatabase, including layers such as:
Administrative-territorial division:
- First-order municipalities (districts and urban districts);
- First-order municipalities (settlements).
- Locations of Sosnowsky's hogweed:
- Areas of Sosnowsky's hogweed growth;
- Spread of Sosnowsky's hogweed by settlements, ha;
- Spread of Sosnowsky's hogweed by districts and urban districts, ha.


Our clients

FAQ


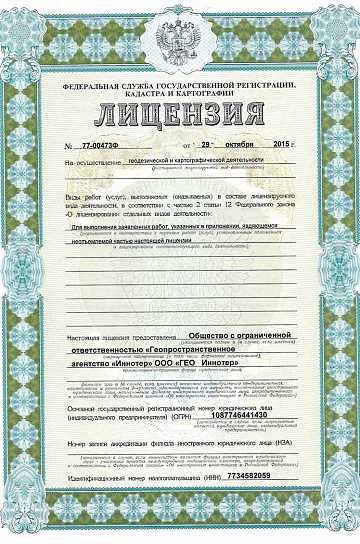
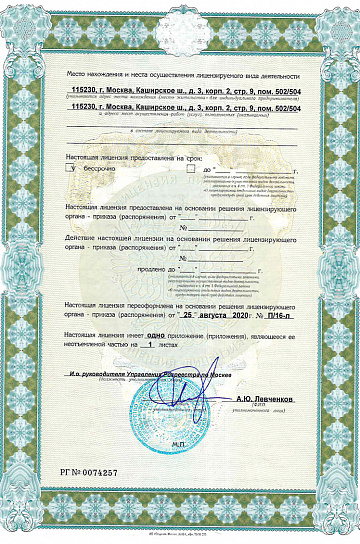
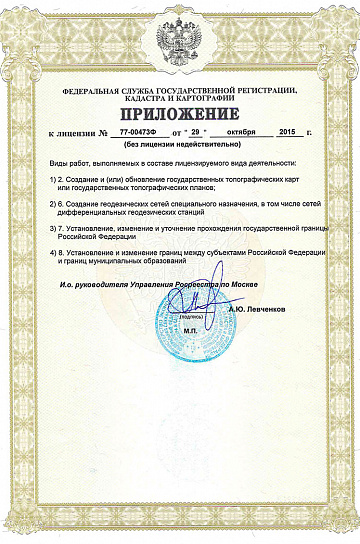
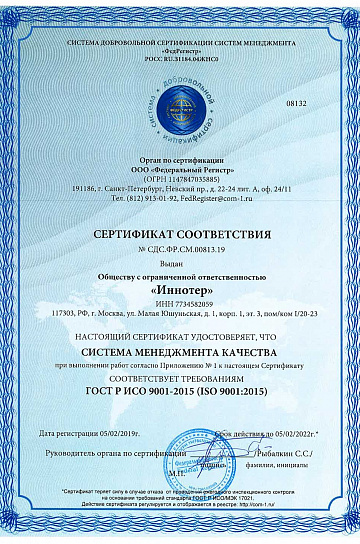
Licenses
Our partners


